import matplotlib.pyplot as plt
import numpy as npA mini example notebook with two plots
Another notebook with an inline and an interactive plot.
Below is a code cell with with a simple tiny embedded inline png image.
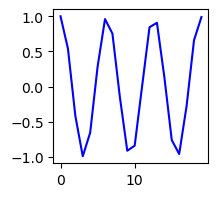
x = np.arange(20)
y = np.cos(x)

fig, ax = plt.subplots(figsize=[2, 2])
ax.plot(x, y, 'b');
..
Interactive images produced with the ipympl package are slightly complicated to deal with. Here is an example how to deal with that. First active the interactive plots with the command:
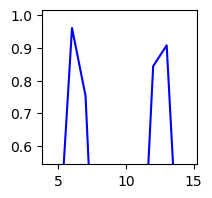
I now generate the same plot as above, and zoom in.
fig, ax = plt.subplots(figsize=[2, 2])
ax.plot(x, y, 'b');
And save the zoom state into an inline plot with:
#|echo: false
plt.gcf()
..