from moseley import PeriodicTable, PeakPatternAtlas
import holoviews as hvPeak pattern atlas
The forest and the trees
Given our ability to generate theoretical XRF spectra we can now build an atlas of spectral peak patterns for different chemical elements. In the following we will ignore the exotic Lanthanides and Actinides and further limit our attention to what I call the Elements Of Interest. To plot the periodic table instantiate the PeriodicTable class and run the .plot() method. The edges of pre-selected elements of interest (to me) are colored red. For interactive plotting we will need to import the holoviews package and activate the 'bokeh' extension.
hv.extension('bokeh')
 ⓘ
ⓘ
table = PeriodicTable()
table.plot_table();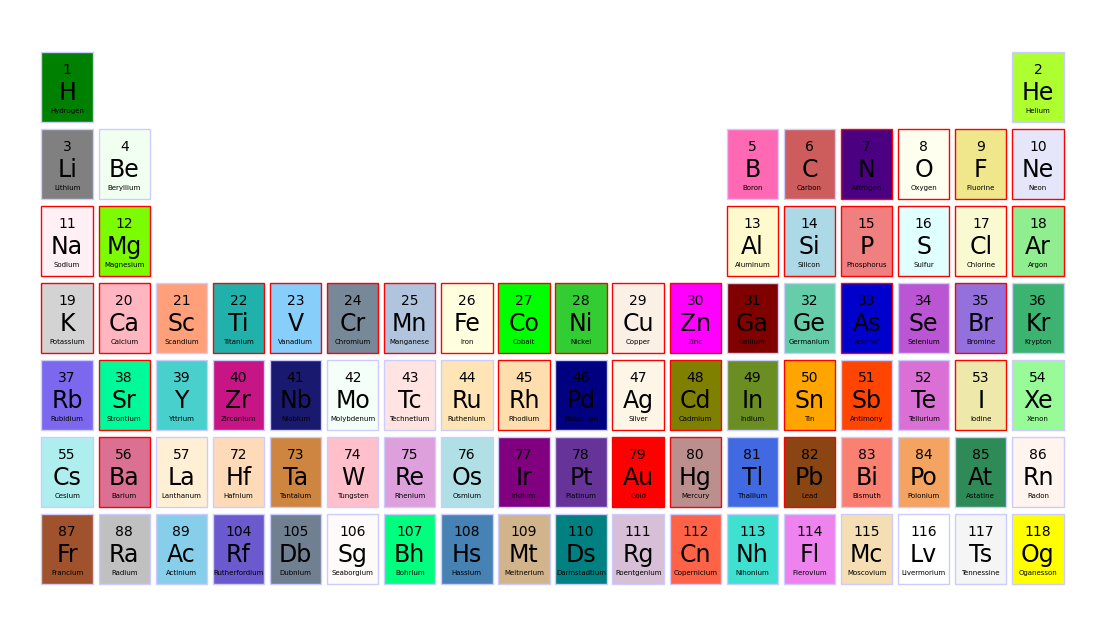
We are now in a position to compute our atlas of elemental XRF peak patterns for elements of interest. This will take some 15 seconds.
ppa = PeakPatternAtlas()Ready building Peak Pattern Atlas! We can now use the .plot_atlas() method to create an interactive holoviews plot.
atlas = ppa.plot_atlas()
atlas
FUNCTIONS
PeriodicTable
def PeriodicTable(
    EOI:NoneType=None
):
Create a periodic table of elements.
colorize
def colorize(
    ptable_regular
):
Generate regular element colors dictionary.
Returns: element_colors_dict
PeakPatternAtlas
def PeakPatternAtlas(
    EOI:NoneType=None, excitation_energy_keV:int=25, h_mm:float=0.001, x_keVs:NoneType=None, verbose:bool=True,
    order:str='alpha'
):
Create a PeakPatternAtlas instance.