from rainbowmaker import read_pdaReading UPLC-PDA data
Getting started
As a very first step we need to read the PDA data from file. Thermo Chromeleon software can export this type of data to a text file that contains a header and a data block. All values are separated with tab characters. To read the data from the text file, import the function read_pda().
indir = '/home/frank/Work/Projecten/Revigo/data/benzylviolet-PDA-export'
os.chdir(indir)
pda_filename = 'Sanne-Export-3d-data-Benzyl-violet_2022-11-28.txt'
header, nms, times, pda_data = read_pda(pda_filename)print(header)File Path chrom://chromeleon/REL_DATA/Aanvragen/2018/2018-096 Benzyl violet/2022 juni.seq/576.smp/DAD1_Spectrum.field
Spectral Field DAD1_Spectrum
Injection Information:
Data Vault REL_DATA
Injection pos 70NCE
Injection Number 3
Position Vial:31
Comment
Processing Method Quantitative PDA 3.0
Instrument Method AFFA 68.50min ddMS2 pos 70NCE
Type Unknown
Status Finished
Injection Date 21/06/2022
Injection Time 09:37:16
Injection Volume (µL) 1.00
Dilution Factor 1.0000
Weight 1.0000
Raw Data Information:
Time Min. (min) 0.000167
Time Max. (min) 68.498500
Scan Min. (nm) 190.000000
Scan Max. (nm) 640.000000
Signal Min. (mAU) -98.869449
Signal Max. (mAU) 1,970.848559
Spectra 82199
Detector DAD1
Detector Type UV
Generating Data System Chromeleon 7.2.9 Build 11323 (300176)
Exporting Data System Chromeleon 7.2.9.0
Spectral Field DAD1_Spectrum
Driver Name Agilent.IcfAdapter.Chromeleon.DdkIcfCore.dll
Raw Data:
And here is a plot of the data.
extent = [times[0], times[-1], nms[-1], nms[0]]

fig, ax = plt.subplots(figsize=[8, 5])
ax.imshow(pda_data.T, aspect='auto', extent=extent)
ax.set_xlabel('Retention time (min)')
ax.set_ylabel('Wavelength (nm)')
ax.set_title(pda_filename);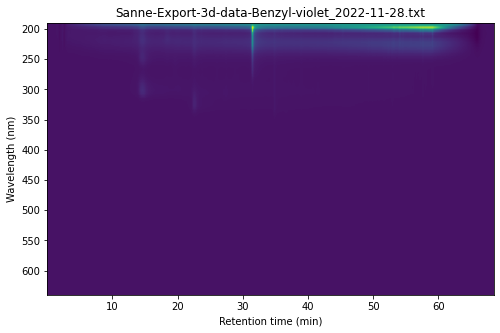
read_pda
read_pda (filename, sep='\t', encoding='utf-8-sig', thousand_sep=',')
Read Thermo PDA text file.
Returns: header, nms, times, pda_data